
Edsight is a series of briefs from the Office of the Deputy Mayor for Education. Each Edsight highlights a key piece of information about Washington, DC's public schools, public school students, and facilities. Email us at [email protected] if you would like to be added to the distribution list.
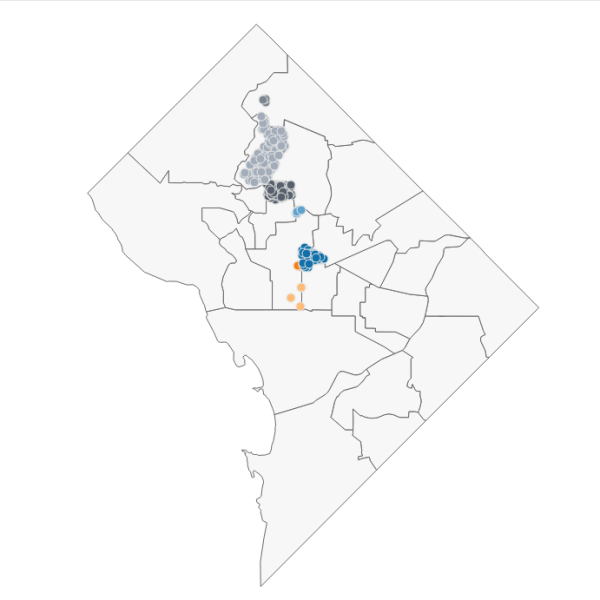
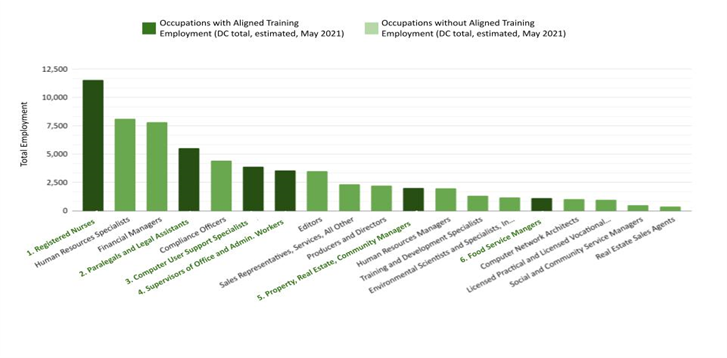 This Edsight examines available workforce training opportunities for openings in DC’s high-demand “Gateway” occupations that best support residents on a path toward upward economic mobility. In 2022, the District funded training to support 1,206 residents in building skills that would position them to pursue 6 out of the 19 available Gateway Jobs in the District. Read the Gateway Job Training Edsight to find out more.
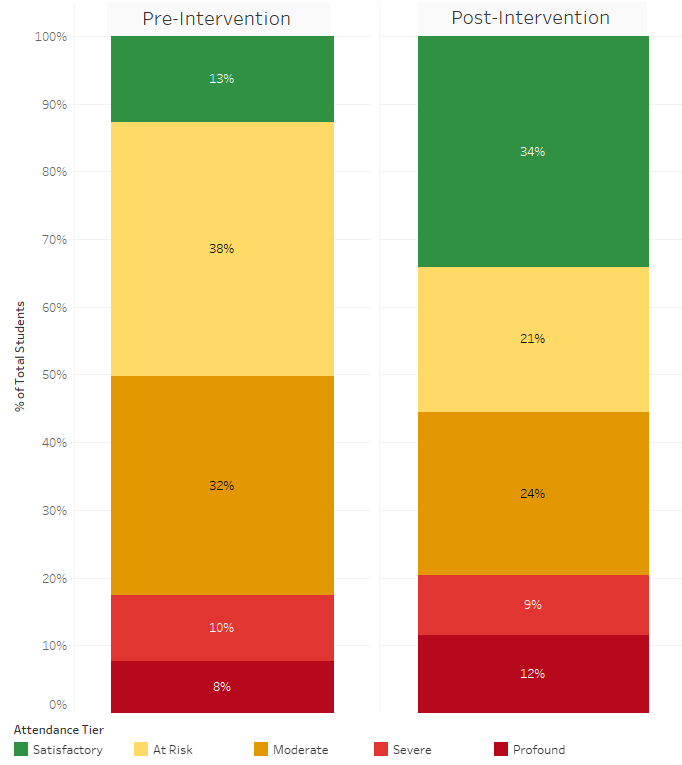 This Edsight provides an update to a previously published Edsight reporting on the observed attendance outcomes before and after the implementation of a “nudge” communication intervention. It shows that while the intervention is still associated with a positive change in the attendance outcomes of some students, there is more work to be done to address the unique challenges of the end of school year. Read the EveryDay Labs End of Year Update Edsight to find out more.
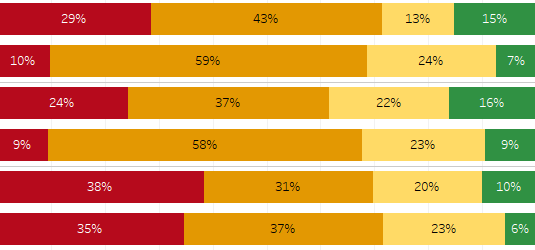 This Edsight examines concentrations of students at risk of academic failure at the school level across geography and school type. It shows how shares of at risk student enrollment have become greater in public schools in Washington, DC. Now, two-thirds of public schools in Washington, DC have at risk student enrollments of greater than 40% and more than one third of public schools have greater than 70% at risk enrollment. The shares are similar across by DCPS boundary schools and citywide schools (public charter schools and DCPS schools with no boundary). Read the At-Risk Concentrations of DC Public Schools Edsight to find out more.
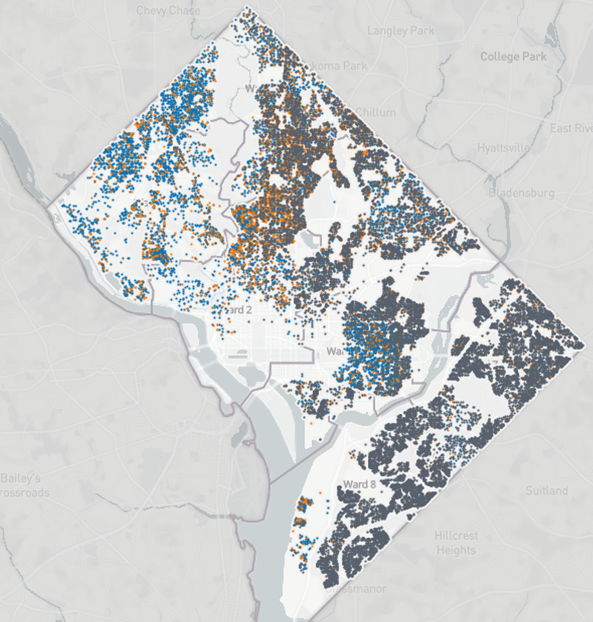 This Edsight examines patterns of where the three largest racial/ethnic groups of students live in Washington, DC. Read the Racial Segregation in DC Public Schools Edsight to find out more.
This Edsight observes attendance outcomes before and after a "nudge" communication intervention was implemented in DCPS and public charter schools. Read the EveryDay Labs Edsight to find out more.
 This Edsight provides an update of the number of students with multiple geographic rights to DCPS schools after the 2014 Boundary and Student Assignment Study. Read the Middle School Multiple Rights Edsight to find out more.
 The Advanced Technical Center helps ensure all public high school students can access citywide Career and Technical Education (CTE) opportunities. Read the Advanced Technical Center Edsight to learn more about how this innovative model works.
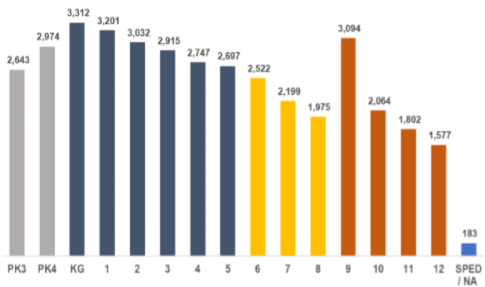
 Washington, DC’s public school system historically gains students in early childhood and 9th grade. Read the Grade Progression Ratio Edsight to learn which grades student cohorts net gain and net lose students and how the sectors (DCPS and public charters) compare.
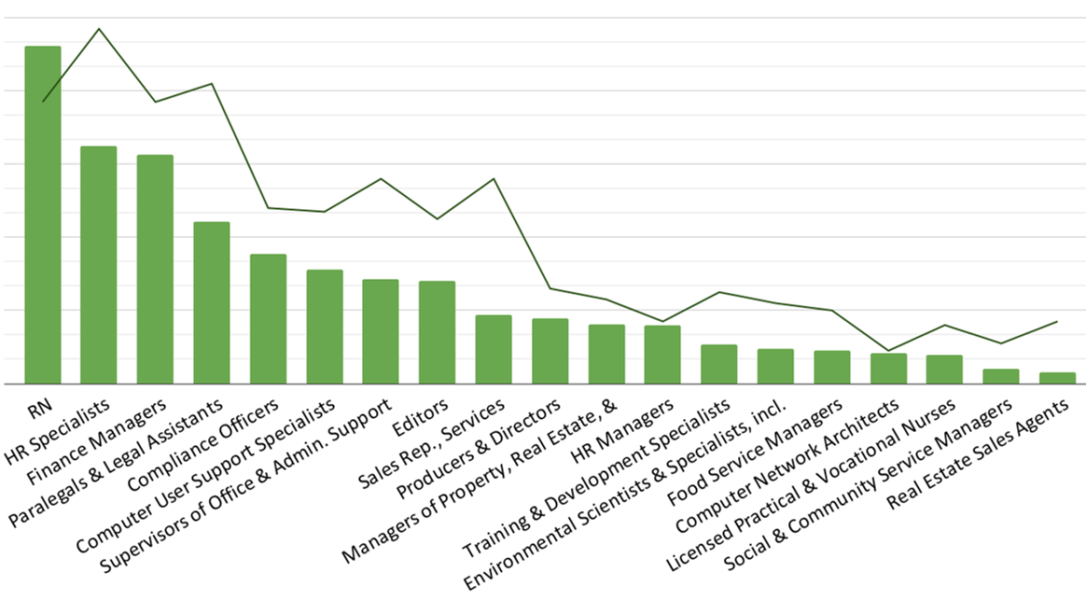 This Edsight examines which high-demand occupations in DC best support residents on a path toward upward economic mobility. Read the Hot Gateway Jobs Edsight.
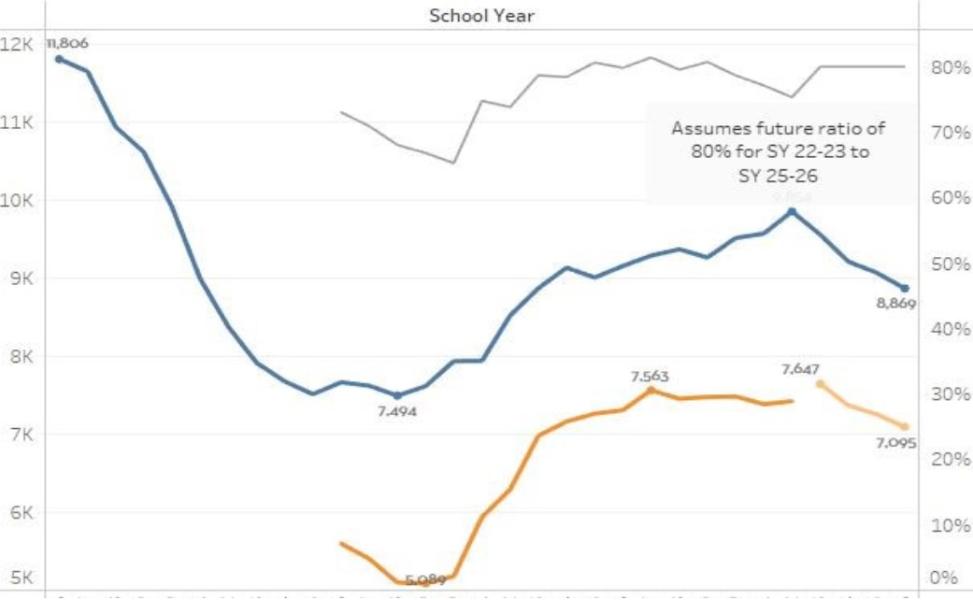 Part Two of a series looking at annual births in Washington, DC forecasts what annual births might mean for future kindergarten enrollment. As annual births have declined in recent years, a decline in future kindergarten enrollment is expected. Read the Birth to Kindergarten Edsight here.
 Part One of a series looking at annual births in Washington, DC overall and by ward through 2020. After years of growth, annual births across DC have been declining since 2016. Ward 8 retains the highest number of births per year but has seen the sharpest decline since 2016. Read the Annual Births in DC Edsight here.
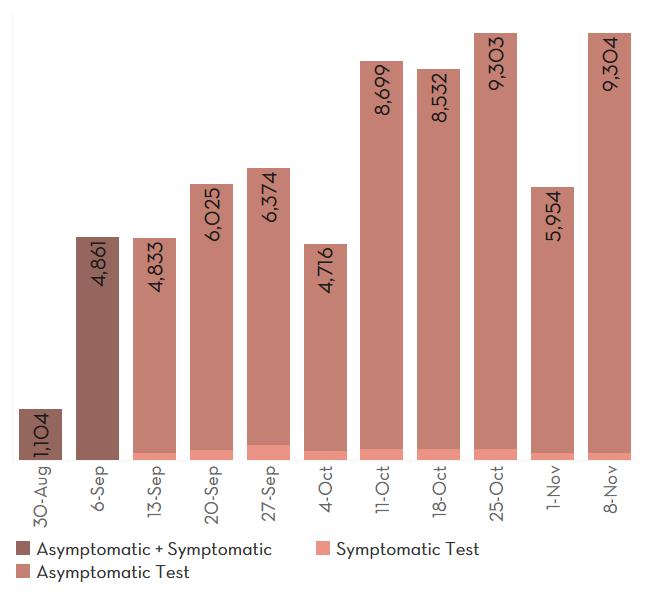 This Edsight highlights the COVID-19 school-based testing program, supported by OSSE and DC Health. As of November 17, nearly 70k tests have been administered since the start of the program on August 30, and less than 0.5% have tested positive for COVID-19. Read the COVID-19 School-Based Testing Edsight here.
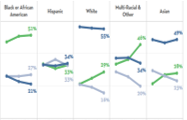 This Edsight is Part Two of a series focusing on public school enrollment by race/ethnicity through SY20-21. Approximately 21% of Black students attend their in-boundary DCPS school compared to 34% of Hispanic students and half of white and Asian students. Read the Trends in Enrollment Types by Race/Ethnicity Edsight here.
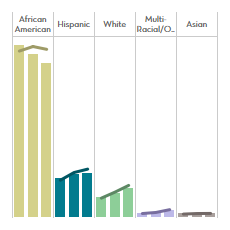 Part One of a series focusing on public school enrollment by race/ethnicity through SY20-21, this describes how Black students remain the majority but account for a small fraction of public school enrollment growth since SY13-14. White students have driven growth at elementary school and Hispanic students have fueled growth at the secondary level. Read the Citywide Trends in Enrollment by Race/Ethnicity Edsight here.
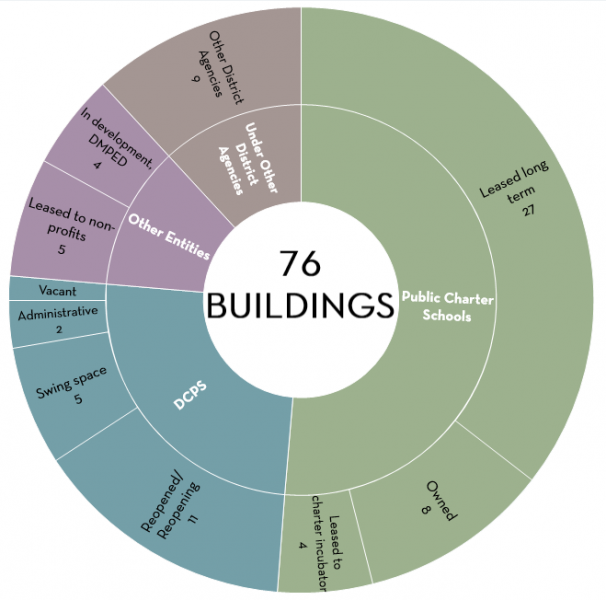
This update to the Vacant Facilities Edsight previously posted in 2019 looks at how formerly closed DCPS school buildings are being used today. Of the 76 closed DCPS school buildings owned by the city or public charter schools, 11 have reopened or will reopen as DCPS schools and only 1 remains vacant. Read the updated Closed Facilities Edsight here.
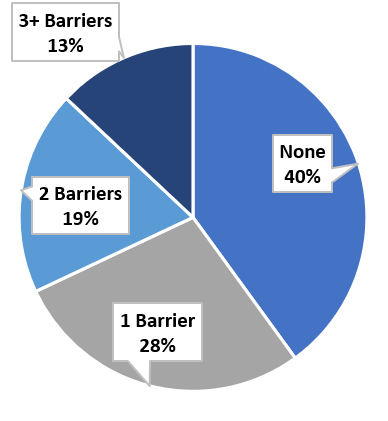 In summer 2020, unemployed District-area workers were surveyed to identify supports needed and barriers faced to return to employment. Part Two of this two-part series explores the challenges faced as they pursue employment opportunities amid the pandemic. Read the Impacted Worker Survey, Part 2 Edsight here.
 In summer 2020, unemployed District-area workers were surveyed to identify supports needed and barriers faced to return to employment. Part One of this two-part series focuses on the supports identified as necessary to pursue employment opportunities. Read the Impacted Worker Survey, Part 1 Edsight here.
 The 2020 UPSFF study on school funding in DC found that ELL student outcomes improved in the elementary grades, but proficiency gaps increased for middle and high school grades. Read more about ELL student population trends and academic outcomes here.
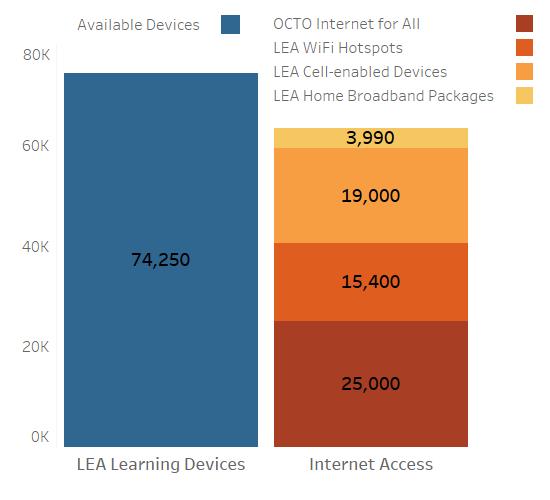
The coronavirus public health emergency has limited the amount of in-person learning possible this fall. Read this Edsight to learn how Washington, DC is ensuring students have devices and internet access for learning at home.
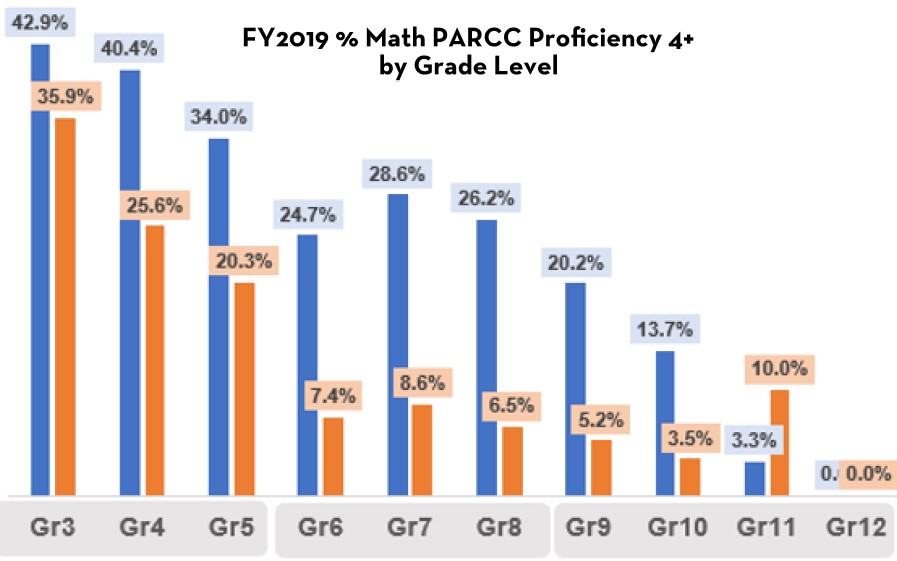
 A new study reveals PARCC proficiency gaps have increased for all categories of DC students who are at-risk for academic failure from 2015 to 2019. Students who were over-age in high school and students in foster care had the largest gaps. Read more about the study and findings here.
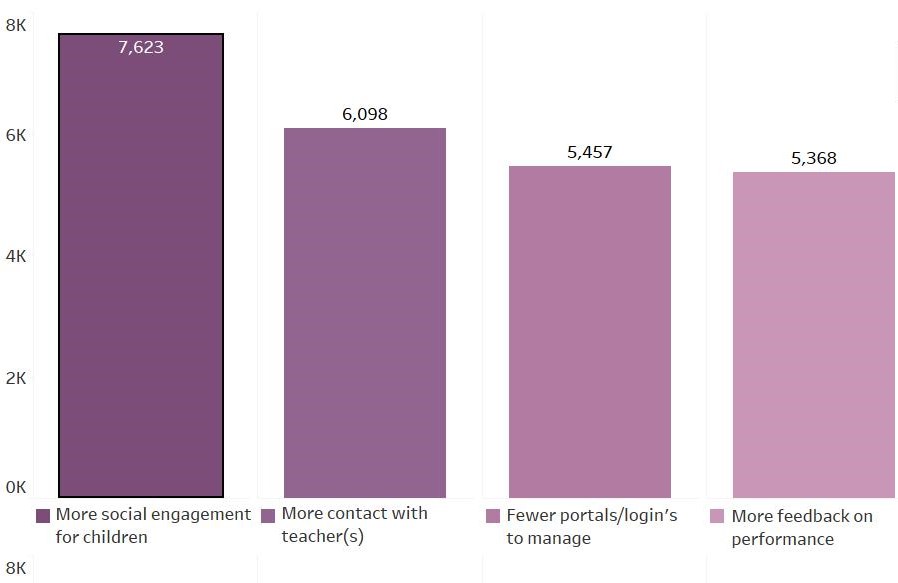 In the DME Family Engagement Survey (conducted June 2020), families were asked how virtual learning went when school buildings were closed during the spring. Families responded with challenges faced and what improvements could be made to make the virtual learning experience better. Read the Edsight on Lessons Learned here.
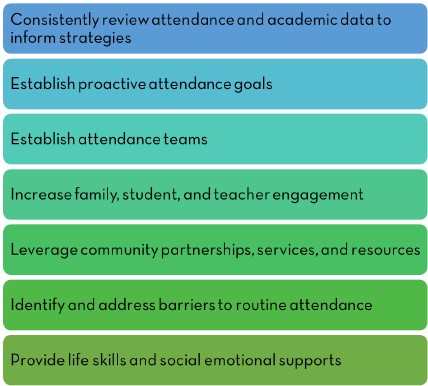 Seven types of interventions lead to improved attendance rates at nine schools. Read the Edsight on absenteeism interventions here.
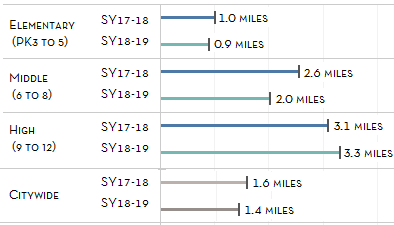
The overall median commute for students to get to their to 4 and 5 STAR rated schools decreased between SY17-18 and SY18-19 to a median distance of 1.4 miles. Read the Commute Distance to 4 and 5 STAR Rated Schools Edsight here.
Of the 19,700 Unfilled Programmatic Capacity in SY18-19, more than 2,500 were in 4 and 5 STAR rated school facilities. Read the Unfilled Programmatic Capacity at 4 and 5 STAR Rated Schools Edsight here.
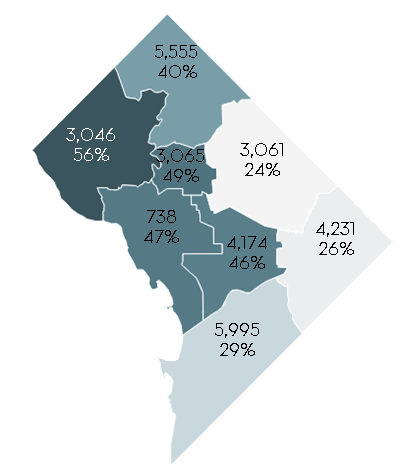
 Almost half of audited elementary public school students attended a 4 or 5 STAR school in SY18-19. Read more about elementary enrollment at highly rated schools by student home ward in the Edsight brief here.
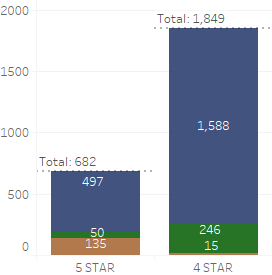
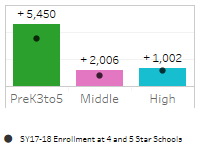
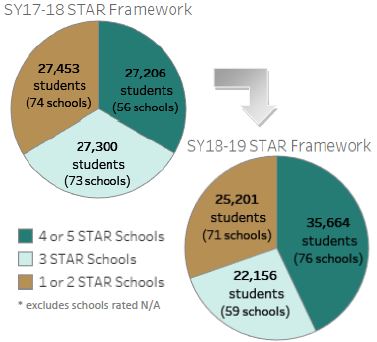 In SY18-19 almost 8,500 more audited public school students attended either a 4 or 5 STAR school compared to the previous school year. Read the Improvements in STAR Ratings Edsight brief here.
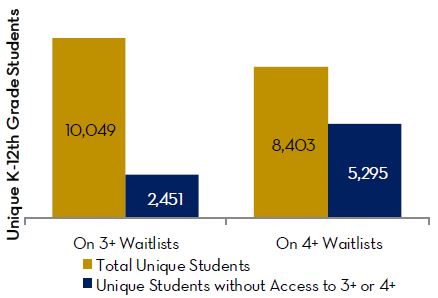
Nearly 2,500 K-12 students who were waitlisted at 3+ STAR schools had access to only lower-rated schools. Read the Public School Lottery Waitlists Explained, Part 2 Edsight brief here.
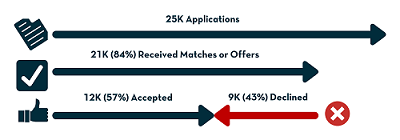 Almost half of all students in the SY2018-19 My School DC lottery declined their initial matches and waitlist offers to enroll. Read the Public School Lottery Waitlists Explained, Part 1 Edsight brief here.
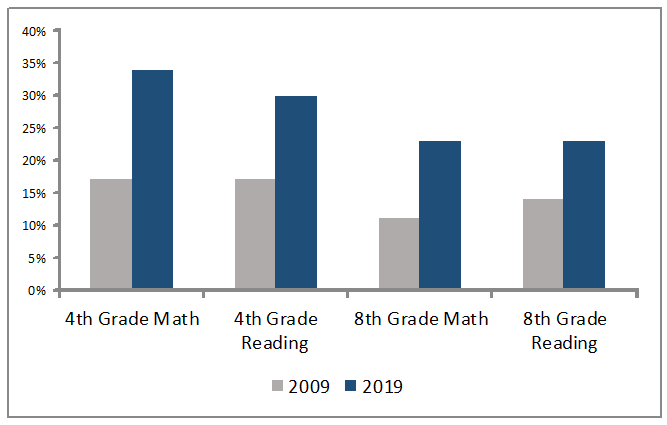 Public school students in Washington, DC made significant gains in the latest National Assessment of Educational Progress (NAEP), outpacing the rest of the country in growth. Read the NAEP Edsight brief here.
 The Walking Distance Edsight describes the distance between home and school for public school students in Washington, DC. More than one-third of public school students live within a comfortable walking distance to their school. Read the Walking Distance Edsight brief here.
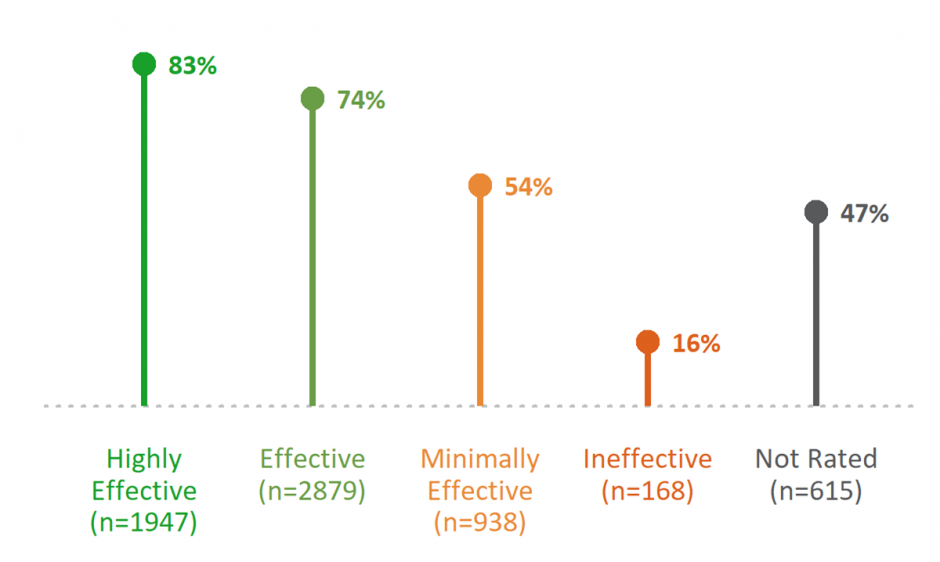
Washington, DC retains effective public school teachers. The Teacher Retention Edsight examines new data about teacher retention, experience, and diversity. Read the Teacher Retention Edsight brief here.
The traditional and public charter schools in Washington, DC collaborate widely and frequently. Read the Edsight brief identifying over 60 examples of cross-sector collaboration here. Download the table in Appendix I here.
The Vacant Facilities Edsight looks at how closed DCPS schools are being used today. Of the 70 closed DCPS school buildings owned by the city or public charter schools, only 3 remain vacant. These buildings are being assessed for future need. Read the Closed Facilities Edsight brief here.