

The Office of the Deputy Mayor for Education is pleased to introduce Inside DC Education — our blog featuring stories, updates, and perspectives from across the District’s education continuum, from early childhood to career pathways.
We’ll take you behind the scenes to highlight the people, partnerships, and progress shaping the future of education in Washington, DC. You’ll hear directly from the Deputy Mayor for Education and our partners on how we’re working together to make sure every student in DC can learn, grow, and thrive.
Understanding SY2025-26 Enrollment Trends
DME has released a five-part blog series. The first three posts examine the primary factors contributing to the SY2025-26 enrollment decline. Key drivers of the decline include lower prekindergarten (PreK) enrollment, fewer students living in Ward 8, and lower Latino enrollment. Parts 4 and 5 analyze enrollment trends among students from closed schools.
Part 1: Lower Prekindergarten Enrollment Contributed to the SY2025-26 Public School Enrollment Dip
Part 2: DCPS’s Latest Enrollment Downturn Partially Due to Ward 8 Declines
Part 3: Latino Enrollment Decline Contributes to Public School Enrollment Dip
Part 4: Analysis of Public Charter School Closures in the District between SY2013-14 and SY2024-25
Part 5: Where Do Students Enrolled at Closing Public Charter Schools Enroll Next Year?
Understanding SY2025-26 Enrollment Trends – Part 1
Lower Prekindergarten Enrollment Contributed to the SY2025-26 Public School Enrollment Dip
Smaller PreK cohorts will likely result in smaller elementary schools moving forward
June 29, 2026 by Jennifer Comey, Director of Planning and Analysis | [email protected]
Part 1 of this series focuses on PreK enrollment. PreK enrollment is not compulsory, meaning families are not required to enroll their 3- and 4-year-olds in school. However, the District has invested heavily in PreK education to support readiness for school resulting in 83% of 3-year-olds and 95% of 4-year-olds being in publicly funded PreK (Fiscal Year 2024 Pre-K Report).

DC has experienced two years of PreK decline following the COVID-19 rebound years
PreK enrollment steadily increased until SY2019-20 and then steeply declined during the COVID-19 pandemic (SY2021-21 and SY2021-22) when many families opted not to enroll. Enrollment rebounded once schools were fully in person but declined in SY2024-25 and again in SY2025-26 (see Figure 1).
Figure 1: Citywide PreK enrollment over time
PreK enrollment has been recently declining after rebounding post COVID-19

Public charters enroll more PreK students and have experienced more recent declines
The public charter sector enrolls more PreK students than DCPS (see Figure 2) and did not experience as sharp of an enrollment decline during the pandemic as DCPS did. However, the charter sector experienced greater declines in the last two years (see Figure 3 for enrollment changes in PreK compared to the year before).
Figure 2: PreK enrollment over time by sector
Public charters enroll more PreK students than DCPS
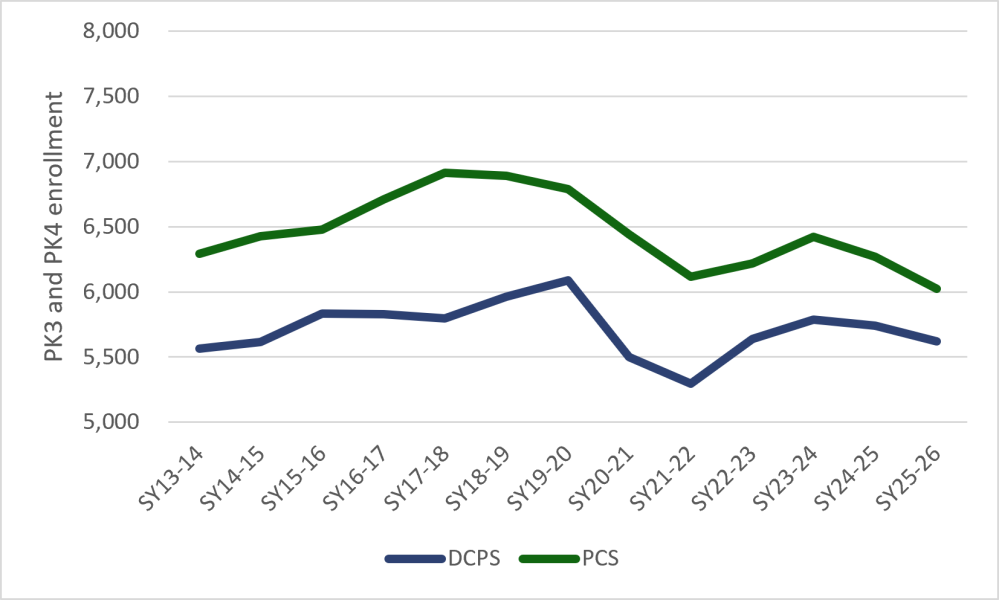
Figure 3: Changes in PreK enrollment over time by sector
Public charters have experienced greater decreases in PreK in recent years

Fewer My School DC lottery applications for PreK suggest continued lower enrollment for SY26-27
There were fewer PreK applications for the 2026 My School DC lottery (MSDC), suggesting that PreK enrollment may further decline in SY2026-27 as well (see Figure 4). Because PreK is not compulsory, all families must apply through MSDC to enter a new school at these grades; therefore, applications are a more reliable indicator of upcoming enrollment than compulsory grades where students can access their in boundary DCPS school or their geographic or programmatic feeder school without an application. The 10% decrease in PreK applications in 2026 is likely to result in smaller elementary school cohorts that further suppress future overall enrollment as the smaller cohorts matriculate through the system, replacing the currently large ones.
Figure 4: Number of PK3 and PK4 My School DC lottery applications
PreK lottery applications decreased by 10% in 2026 compared to the year before

Note: See the My School DC lottery board April 30 presentation for more detail https://www.myschooldc.org/about/common-lottery-board
Steadily declining births are finally affecting with PreK enrollment
One of the major reasons for this decline in PreK enrollment is the decreasing number of births. Births have been declining annually over the past 10 years (see Figure 5) and the latest preliminary figures suggest further declines. Unless birth rates rebound, migration into the city increases, or higher shares of existing families enroll in our public schools, both DCPS and public charters should be prepared for smaller PreK cohorts moving forward that will eventually result in lower overall enrollment. Policymakers need to take these trends into account when making school planning decisions such as opening new schools or expanding existing ones.
Figure 5: Births in DC over time
Births have been steadily declining since 2016

Understanding SY2025-26 Enrollment Trends – Part 2
DCPS’s Latest Enrollment Downturn Partially Due to Ward 8 Declines
Fewer Ward 8 students will likely impact both sectors in the future
June 29, 2026 by Jennifer Comey, Director of Planning and Analysis | [email protected]
Part 2 highlights the shrinking number of public school students living in Ward 8, driven largely particularly by declining births and changes in residential patterns. Among the smaller pool of school-age children, DCPS schools in Ward 8 enrolled fewer students than Ward 8 public charter schools in SY2025-26. Several Ward 8 public charter schools are relatively new and have been adding a grade each year, creating built in enrollment growth; however, this automatic growth is ending as most schools have reached their final grade.

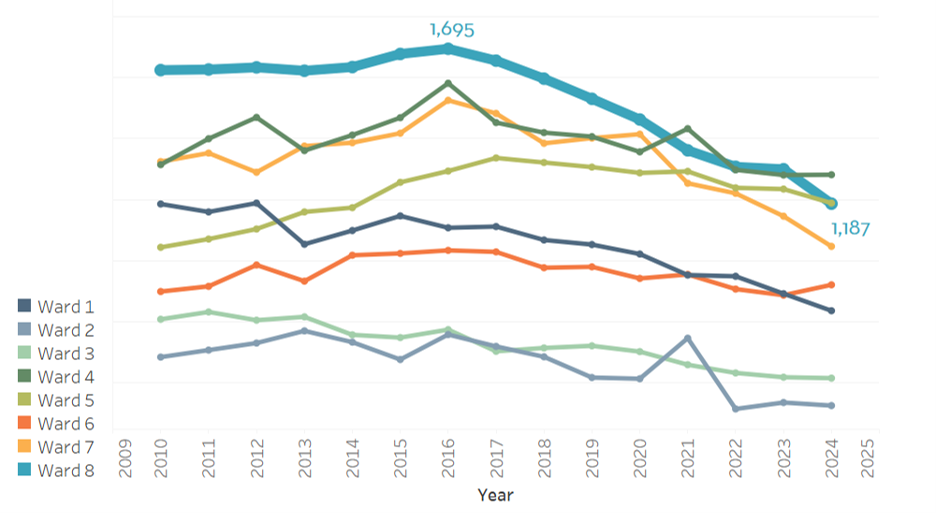
The number of public school students living in Ward 8 has been steadily declining
Ward 8 has historically been home to the largest number of public school students. However, over the past six years, the ward experienced the steepest declines of public school students living there compared to others. Since SY2020-21, the number of prekindergarten (PreK) to 5th grade students living in Ward 8 decreased by at least 2% annually. This translates to a decrease of 1,737 elementary-aged students over the six-school year time period. This year alone, it fell by 4.7% or 528 PK3-5th grade students (see Figure 1 below and EdScape Where Public School Students Live Over Time).[1]
Figure 1: Number of PK-5th grade students living in Ward 8 over time
Approximately 1,700 fewer public PK-5th grade students live in Ward 8 in SY25-26 compared to SY20-21

Focusing specifically on PK3 and PK4 students, the decline in Ward 8 is even more pronounced. From SY2023-24 to SY2024-25, the number of PreK students living in Ward 8 declined by 5.8% (see Figure 2). There was a further decline the following year, when Ward 8 saw a 9.4% drop in the youngest students living there between SY2024-25 and SY2025-26, while citywide, PreK enrollment declined by 3% during that same period.
Figure 2: Number of PreK grade students living in Ward 8 over time
460 fewer public PreK students live in Ward 8 in SY25-26 compared to SY20-21

The decreases in early childhood and elementary grades in Ward 8 likely reflect the declining births in the area, a trend dating back to 2016 (see Figure 3 and EdScape’s Births by Ward). Ward 4 (shown as dark green) now surpasses Ward 8 (shown as teal) as the ward with the largest number of births.
Figure 3: Number of births in Ward 8 over time
There are 506 fewer Ward 8 births in 2024 compared to the peak in 2016
Most DCPS Ward 8 schools declined in enrollment compared to less than half of Ward 8 public charter schools
Among the smaller pool of school-age children, DCPS schools in Ward 8 enrolled fewer students than Ward 8 public charter schools in SY2025-26. DCPS schools in Ward 8 experienced the largest enrollment declines, both compared to Ward 8 public charter schools and DCPS schools located in other wards. Of the 21 DCPS schools in Ward 8, 86% declined in enrollment in SY2025-26: 14 of these schools lost 10 or more students[2] and three lost between one and nine students (see Figure 4). Another four DCPS schools either grew or held steady. The median enrollment change for the Ward 8 DCPS schools was a decrease of 25 students.
By contrast, among the 28 public charter schools in Ward 8, 36% declined in enrollment this year compared to last: six schools decreased by 10 or more students and four decreased between one and 9 students. Seventeen schools grew by at least one student[3] and one school’s enrollment stayed the same. The median enrollment change across the 17 schools was an increase of 19 students.
Figure 4: Number of Decreasing Ward 8 DCPS and Public Charter Schools SY24-25 to SY25-26
17 out of the 21 DCPS Ward 8 Schools Experienced Enrollment Declines

Public charter school enrollment grew partially to growing grades and overall higher commitment compared to DCPS
Almost half (44%) of the public charter PK-12 grade enrollment growth in Ward 8 is due to four relatively new schools expanding to the next expected grade. New schools often open with their youngest grades and add the next annually until they reach their full grade span. Seven newer public charter schools added a grade in SY2025-26, four of which were in Ward 8 (see EdScape’s Public School Facility Locations and Changes for more details). Three of the four growing Ward 8 public charter schools reached their maximum grade this school year, with the fourth expected to do so next year. Therefore, the period of baked in growth with the existing set of Ward 8 schools will be significantly less in school year 2026-27.
For the remaining 11 PK-12 charter schools in Ward 8 that had no change in their grade configuration, some grew because some attracted more PK students than the year before, others had a large specific grade cohort age through, and two of the three secondary schools had larger entry grade enrollment, enrolling rising high school students from both DCPS and other public charter school middle schools. The two adult charters increased in enrollment, one spurred by an increased enrollment ceiling and the other due to a new, modernized facility.
Unless birth rates rebound, migration into the city increases, or higher shares of existing families enroll in our public schools, both DCPS and public charters should be prepared for smaller prekindergarten (PK) cohorts moving forward, particularly in Ward 8, that will result in sustained declines in overall enrollment. Policymakers need to take these trends into account when making school planning decisions such as opening new schools or expanding existing ones.
[1] Ward 7 is the only other ward showing consistent declines in PK-5th graders living there, declining 1% and 2% the last two years. Wards 3, 4, 5, and 6 have shown steady increases. Wards 1 and 2 have remained mostly flat.
[2] Ballou STAY Opportunity Academy, serving adult and alternative students, experienced the largest drop, with 129 fewer students than last year. This was due to an administrative decision to assign the former Ballou STAY virtual students to the Garnet-Patterson STAY Opportunity Academy's virtual program.
[3] Community College Prep PCS, an adult school, experienced the greatest enrollment increase (130 students) after it opened a new facility in Ward 8, consolidating their previous locations.
Understanding SY2025-26 Enrollment Trends – Part 3
Latino Enrollment Decline Contributes to Public School Enrollment Dip
Latino enrollment in DC fell by 3.8%, the only recent decline apart from the first year of COVID-19.
June 29, 2026 by Jennifer Comey and Rebecca Lee, DME Planning and Analysis
Part 3 of this series focuses on the decline in Latino student enrollment.

As of the official enrollment audit in October 2025, there were 790 fewer Latino students enrolled in public schools compared to the year before, a decrease of 3.8%. DCPS elementary through high school grade levels were negatively impacted, while the public charter sector’s adult and alternative schools experienced a decline in enrollment of Latino students.
The fluctuations in Latino enrollment over the last few years stem, at least in part, from national immigration policies. In 2022, the governor of Texas sent a series of buses of recent asylum seekers to Washington, DC and other cities. Soon after, the governor of Arizona followed suit (to learn more, see the DC Office of Migrant Services 2023 abstract). More recently, starting the summer of 2025, the federal government implemented enhanced immigration enforcement and arrests in the District as well as other states. These federal efforts likely had the impact of suppressed enrollment and possible residential moves out of the District. The District does not collect immigration status of public school students, so analytic trends of these specific types of students are not available.
After years of enrollment growth, the Latino student population decreased in both compulsory and non-compulsory grades between SY2024-25 and SY2025-26.
The Latino public school population in Washington, DC grew annually between SY2013-14 and SY2024-25, with a brief decline in SY2020-21 due to the COVID-19 pandemic. By SY2024-25, there were nearly 21,000 Latino students, an increase of 7,500 students compared to the earlier decade. However, in SY2025-26, the population decreased to 20,143 students. This decline occurred in both compulsory grades (kindergarten through grade 12) and non-compulsory grades (prekindergarten and adult programs).
Figure 1: Enrollment of Latino Students over Time, Compulsory and Non Compulsory Grades
Overall Latino enrollment decreased by 3.8% in the most recent school year

Note: while non-compulsory grades include “alternative”, there are some students who are compulsory age.
Of the three largest racial/ethnic groups, Latinos were the only group to lose overall student population in SY2025-26.
The three largest racial ethnic groups in the District’s public schools are Black/African American (61%), Hispanic/Latinos (20%), and white students (13%). Asian/Pacific Islanders represented 1.5% in SY2025-26 while multi-racial and additional groups comprised 4% (see EdScape’s Public School Enrollment by Race and Ethnicity for more details). Among the three largest groups, Latinos were the only group with a decline compared to the prior year. In contrast, the Black student population held steady and the white population increased by 350 students (see Figure 2).
Figure 2: Change in Latino Public School Enrollment Compared to the Year Before Over Time
Latinos were the only major racial/ethnic group to lose enrollment in SY2025-26

Note: Enrollment includes all grade levels including adult and alternative schools
Latino enrollment losses were disproportionately among students living in Wards 1, 4, and 5 as well as among English learners and students designated as at-risk.
Latino student enrollment declines were concentrated in Wards 1, 4, and 5 neighborhoods where the most Latino students have historically lived (see EdScape Public School Students by Race/Ethnicity and Geography). Some neighborhoods east of the Anacostia River had modest enrollment gains but these were not enough to offset the overall losses in the northern and central parts of the city. For example, the number of Latino students living in Ward 1 decreased by 311 in SY2025-26, representing 30% of all Latino enrollment decline. Similarly, Ward 5 lost 361 Latino students in SY2025-26, representing 35% of enrollment decline that year.
Among the PK3 to 12 population, overall Latino student enrollment declined by 402, but there were disproportionate drops in Latino enrollment among English learners (-846 English learners who are Latino) and among students designated as at-risk of academic failure (-879 students designated at-risk who are Latino.) Overall Latino student enrollment declined by a smaller magnitude than this subset of student groups due to increased enrollment of Latino students who are not English learners or designated as at-risk.
DCPS lost PK3 to 12th grade students while the drop in public charter schools was among adult and alternative students.
The decline in Latino enrollment differed by sector. Latino enrollment in DCPS schools in SY2025-26 was 435 students less than the previous school year and most of that decline was in PK to 12th grade, with a drop of 398 students. The decline of 355 Latino students in public charter schools was entirely in adult and alternative schools (see Figure 3).
Figure 3: Change in Latino Public School Enrollment Compared to the Year Before by Sector
Fewer DCPS PK-12 grade students enrolled in SY2025-26 while the public charter sector had fewer adult and alternative Latino students

Exiting middle Latino students spent less time in the District’s school system than exiting students in previous years
Excluding 12th graders, more than 3,400 Latino students exited the public school system after SY2024-25, meaning they were not enrolled as of the October 2025 enrollment audit. This was 20% higher than the averaged three previous school years: between SY2021-22 and SY2023-24, an average of 2,859 Latino students exited the system (see Table 1).
In addition, middle school Latino students who exited recently had been enrolled in Washington, DC’s public schools for less time than their exiting counterparts in previous school years, measured by average and median length of time. For example, the median number of years in the public school system for middle school Latino students at exit was 5 years versus 7 years in the prior three averaged school years, and a mean of 5.5 years versus 6.1 years in the prior three averaged school years.
Table 1: Number of years in enrollment audit by grade band of exiting Latino students

Understanding SY2025-26 Enrollment Trends – Part 4
Analysis of Public Charter School Closures in the District between SY2013-14 and SY2024-25
June 30, 2026 by Jennifer Comey and Rebecca Lee, DME Planning and Analysis
Part 4 examines the landscape of school closures over the past 12 years through the end of SY2024-25 to build a stronger fact base and inform the field as policymakers make decisions around policies related to reviews and closures such as DC PCSB’s accelerated review policies and the introduced lottery preference legislation for families impacted by school closures. We focus here on charter schools because the school closures in the period studied have been almost exclusively in the charter sector. District of Columbia Public Schools (DCPS) closed a total of 42 schools in SY2008-09 and SY2012-13, but student-level data for those closure years are unavailable, preventing analysis.
The District’s robust public charter sector has and continues to play an important role in improving public education outcomes. Public charter schools benefit from greater autonomy and flexibility, which supports innovation. In exchange, they must meet the performance goals outlined in their charter agreements—contracts between DC PCSB and each school’s board of trustees—or face potential closure. These agreements help ensure that public charter schools adhere to their charter agreements, uphold strong performance standards, and deliver for children.
This blog focuses specifically on how many public charter schools have closed since SY2013-14, why they closed, and–for the first time compiled–when school communities were informed.[1] A downloadable data file with school details is available for further exploration.
We found:
- While a closure can be very difficult and disruptive, the share of students impacted is modest over the period studied. Thirty-four public charter schools closed between SY2013-14 and SY2024-25, enrolling nearly 10,000 students at the time of their last enrollment audit, about 1.9% of total charter enrollment over that timeframe.[2]
- Most of the public charter closures, 70%, were announced at least a week before the lottery deadline.
- Of the 10 closures announced near or after the lottery deadline:
- Five closed primarily for academic reasons and five closed due to financial/low enrollment.
- Four occurred during a DC PCSB renewal or review process, and three of the four charter school boards voted to relinquish their charter.
DC PCSB authorization and review of public charter schools
This year marks the 30th anniversary of the District of Columbia School Reform Act of 1995 (SRA), which established the DC Public Charter School Board (DC PCSB) and paved the way for the opening of the first public charter schools. The growth of a strong public charter sector has been a significant contributor to the District’s improved public education outcomes (see The State of Schools in Washington, DC is Strong – and Getting Stronger). In exchange for greater autonomy, innovation, and flexibility, public charter schools must meet the performance goals in their charter agreements—contracts between DC PCSB and each school’s board of trustees—or face potential closure. This accountability system, which includes closures as a consequence of inadequate performance or sustainability, is different than that of traditional school systems like DCPS. These agreements help ensure that public charter schools adhere to their charter agreements, uphold strong performance standards, and deliver for children.
DC PCSB, an independent government agency in the District, authorizes the opening of public charter schools, granting a 15-year term for each charter. The SRA requires DC PCSB to conduct a review of each charter school[3] at least once every five years following its opening. If a charter school wishes to continue operating after 15 years, it must submit a renewal application requesting another 15-year term. Reviews evaluate:
- Progress toward charter goals,
- Academic achievement,
- Legal and financial compliance to applicable laws, and
- Governance quality.
These reviews and renewals provide predictable checkpoints for DC PCSB to assess a school’s progress. Based on these reviews, DC PCSB may:
- Allow a school to continue with or without conditions,
- Approve renewal for another 15-year term, or
- Revoke the charter, resulting in closure.
Schools may also close voluntarily due to decisions by their boards of trustees sometimes in response to review findings, financial reasons, or for other matters. For more information, see the SRA and DC PCSB’s explainers.
No two closures are exactly alike, and the process may involve many steps. Below, we describe the scope and timing of public charter school closures over the past 12 years, using available sources to identify when school communities were likely informed, which includes public notification of a charter relinquishment or the public notification of a revocation.[4] These dates may vary depending on the closure mechanism and cause(s).
20% of all public charter schools closed in the last 12 years, representing 1.9% of total charter enrollment
Between SY2013-14 and SY2024-25, 34 public charter schools closed, representing 20% of all public charter schools operating during that timeframe (see Appendix 1 for a listing of individual school closures including location, closure mechanism, timing, and reasons.). Two-thirds of these were full local education agency (LEA) closures (23 schools), and one-third were partial LEA closures (11 schools), meaning other schools within the LEA continued to operate. Additionally, seven schools had phased closures, progressively closing one grade each year until the final grade closed. One also occurred because a public charter school provided educational services at the DC Jail temporarily until the Department of Corrections (DOC) was prepared. Today, the DOC contracts with the same nonprofit organization to provide educational services there.
These 34 closed schools had a combined 9,869 students enrolled as of their last enrollment audit, representing 1.9% of charter school enrollment over that timeframe.
70% of public charter closures were announced at least a week before the lottery deadline
While school closures are a natural component of the public charter school model, they can be destabilizing and disruptive for communities, especially when they occur late in the school year after the My School DC common lottery deadline.
The best-case scenario is when families are informed that their school is undergoing a charter review or renewal process (which lasts more than one year), and closure decisions are communicated with sufficient time for families to plan for their next school, including participating in My School DC.
Among the 34 public charter school closures since SY2013-14:
- 23 closures were announced prior to the relevant lottery deadline,
- 10 closures were announced within a week of or after the lottery deadline,
- 1 closure was not applicable (Maya Angelou PCS - Academy at DC Jail, a placement-based school that continues to provide contracted services).
Figure 1: Closures by timing relative to first relevant lottery deadline, SY2013-14 to SY2024-25

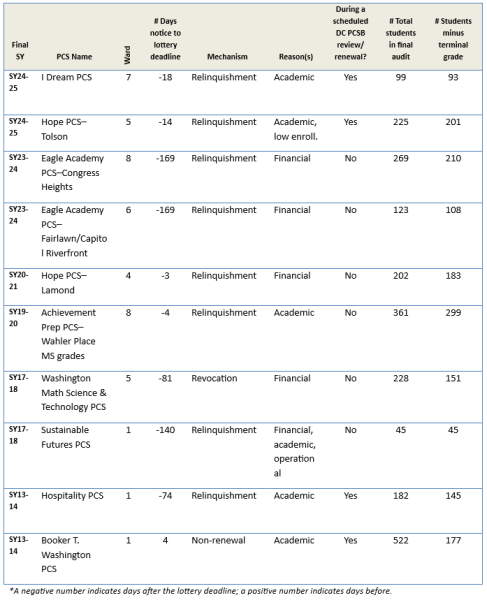
Table 1 lists the individual public charter schools that closed within a week of or after the My School DC lottery deadline. It includes their final operating school year, number of days between public notice of relinquishment or revocation and the lottery deadline, reasons for closure, and the number of students impacted.
Of the 10 closures announced near or after the lottery deadline, five closed primarily due to academic reasons and five closed due to financial/enrollment reasons. Only four of the 10 occurred during a DC PCSB renewal or review process; three of the four charter school boards voted to relinquish their charter.
Table 1: Closures within a week of or after lottery deadline, SY2013-14 to SY2024-25
Large docket of public charter school reviews and renewals in SY2024-25 and SY2025-26
In SY2024-25, DC PCSB conducted 20 public charter school reviews and renewals, resulting in:
- Eleven reviews leading to continuances without conditions, meaning the public charter school has another five years before the next anticipated DC PCSB review;
- Seven reviews leading to continuances with conditions, meaning the DC PCSB reviewed the status of the school’s progress in meeting the conditions in fall 2025 and will again in SY2025-26 (assessments of the schools’ progress will occur in the fall of 2026 once data are available).
- Two schools relinquished their charters after the lottery deadline in response to proposed or imposed conditions for continuance (I Dream PCS and Hope PCS-Tolson, listed in Table 1).
- One school with conditions from its SY2024-25 review relinquished its charter in SY2025-26 prior to the SY2026-27 lottery deadline (Capital Village PCS).
There were 16 public charter schools up for a regular cycle review or renewal in SY2025-26, resulting in:
- Nine reviews/renewals leading to continuances without conditions;
- Seven reviews/renewals leading to continuances with conditions.[5]
This year, DC PCSB implemented several changes to accelerate review and renewal decisions, including holding earlier pre-meetings with schools and publishing preliminary charter-specific school evaluation reports sooner.
The DME will continue to add to the longitudinal dataset found in EdScape’s School Opening and Closing Trends to track the timing of relinquishment or revocation decisions. More information about the DC PCSB review/renewal schedule is available on their website.
Resources
For ongoing updates visit EdScape’s School Opening and Closing Trends page.
Appendix 1: Table of closures between SY13-14 and SY24-25
Notes
[1] The timeframe starts with SY2013-14 instead of SY2012-13 (provided in EdScape) because student data are available from SY2013-14 forward.
[2] Capital Village PCS relinquished its charter effective the end of the SY2025-26 academic year and is not included in this analysis.
[3] A “school” in this context refers to a local education agency (LEA). Some charter “schools” are single-campus LEAs (e.g., DC Bilingual PCS) while others are multi-campus LEAs (e.g., KIPP DC PCS).
[4] Public notification ranges from the DC PCSB including the relinquishment or revocation in their public record to the school’s board publicly notifying families.
[5] Public Charter Schools Reviews and Renewals for School Year 2025-26 | DC PCSB
Understanding SY2025-26 Enrollment Trends – Part 5
Where do students enrolled at closing public charter schools enroll next year?
June 30, 2026 by Jennifer Comey and Rebecca Lee, DME Planning and Analysis
Part 5 examines where students from public charter schools that closed between SY2013-14 and SY2024-25 enrolled the following year by sector, type of school (including takeover schools), and timing of the announcement. The analysis focuses exclusively on closed public charter schools as only one DCPS alternative school closed during the time period analyzed here, which is excluded for simplicity and to avoid drawing conclusions based on just one school.[1] District of Columbia Public Schools (DCPS) closed a total of 42 schools in SY2008-09 and SY2012-13, but student-level data for those closure years are unavailable, preventing analysis.
The District’s robust public charter sector has and continues to play an important role in improving public education outcomes. Public charter schools benefit from greater autonomy and flexibility, which supports innovation. In exchange, they must meet the performance goals outlined in their charter agreements—contracts between DC PCSB and each school’s board of trustees—or face potential closure. These agreements help ensure that public charter schools adhere to their charter agreements, uphold strong performance standards, and deliver for children.
This analysis shows how families navigate their school options when a public charter school closes, offering insights into the ways families exercise choice across the District’s public education landscape.
We found:
- Thirty-four public charter schools closed between SY2013-14 and SY2024-25, enrolling nearly 10,000 students at the time of their last enrollment audit, about 1.9% of total charter enrollment over that timeframe. While closures can be difficult and disruptive for those involved, the share of students impacted is modest over the full time period.
- Almost three-fourths of families from closed schools opt to enroll at a public school other than their by right DCPS school. A majority of students in non-terminal grades from the closed public charter schools, 52%, continued in the public charter sector the following year, another 11% enrolled at an out of boundary DCPS school, and 8% enrolled at a DCPS takeover option.
- Students leave the public school system when closures happen (15% on average or 1,264 students) so early notice and enhanced family support is needed. 14% of students left when given timely notice and 21% with late notice. We do not know whether the students switch to private school, leave the city, or disengaged entirely. Among those students not in the following school year’s audit (meaning not enrolled at a DCPS or public charter school), most (942) did not return to the Washington, DC public school system during the analytic timeframe (SY2014-15 to SY2025-26), while 322 students appeared in an enrollment audit two or more years after their school closed.
- Slightly more than half of students capitalize on takeover school options (57%) but still disperse to 35+ different schools on average, regardless of whether a takeover school was available.
- A small but notable number of students, 641, experienced multiple closures during the period studied. We as a city need to identify ways to minimize this happening going forward.
School closures are an exception rather than the norm but have a considerable impact on the closing schools’ students, families, and staff. Post-closure enrollment patterns emphasize the need for timely accountability and financial reviews, which DC PCSB is accelerating. Clear communication and support are crucial for families so they can make well-informed decisions about their next school before the common lottery deadline.
Approximately 8,200 public charter students needed to find a new school for the following year due to school closure.
The closures described below affected nearly 8,200 students who needed to select a new school, underscoring how essential it is that families are informed of school closures with enough time to make decisions about the full range of public school options available to them. Between SY2013-14 and SY2024-25, 34 public charter schools closed[2] with 9,869 students enrolled as of their last enrollment audit, representing 1.9% of charter school enrollment over that timeframe. Excluding the students enrolled in the last or terminal grade of the school and adult students, 8,173 students needed to find a new school to attend the following year due to the closure.[3] Unless noted otherwise, the remainder of this analysis excludes students enrolled in the terminal grade of the closed school, as they already planned to attend their next grade at another school.
A majority (52%) of students from closed public charter schools enrolled in the public charter sector the following year.
A little more than half of the students from closed schools (52% or 4,282 students) remained in the public charter sector the following year. Almost one-third (31%) enrolled in DCPS schools and 15% left the public school system (not enrolled in either DCPS or public charters) as of the following October (see Figure 1). The charter enrollment is seven percentage points higher than the citywide share of prekindergarten to 12th graders attending public charters in SY2025-26.
Figure 1. Where students from 34 closed public charter schools enrolled the next year, by sector SY2013-14 through SY2025-26

Note: The OSSE-managed category refers to Hospitality HS that was briefly managed by OSSE following the closure of Hospitality PCS after SY13-14.
Focusing only on students who enrolled in DCPS schools, 12% of students enrolled in their in boundary DCPS school, 11% enrolled in a DCPS out of boundary or citywide DCPS school, and 8% enrolled at a DCPS takeover school.[4] These DCPS statistics are all lower than the citywide average of 55% enrolling at a DCPS school (irrespective of type).
These enrollment patterns demonstrate the ongoing appeal of school choice for charter families even in closures situations.
Among the 1,264 students who were not in the following audit (meaning not enrolled at DCPS or public charter school), most (942) did not return to the Washington, DC public school system during the analytic timeframe (SY2014-15 to SY2025-26), while 322 students appeared in an enrollment audit two or more years after their school closed.
When public charter students learn of closures close to or after the lottery deadline, they are less likely to stay in the public charter sector and more likely to leave the public school system. The share of students choosing to enroll at DCPS does not change based on timing after a public charter closure.
Timely communication is essential for families as they plan for the upcoming school year and decide whether to apply to the My School DC lottery. When families learn about school closure after the lottery deadline, seats at other schools that families may be interested in are often no longer available because they have already been matched to other students. Although families can join post-lottery waitlists, the likelihood of receiving an offer at that point is greatly reduced. Only 42% of public charter students remain in the public charter sector if their school closure was announced close to or after the My School DC lottery deadline (referred to as “late closures”) as compared to the 55% of those who had earlier notice of their school’s closure (see Figure 2). The share enrolling after closure at DCPS schools is the same regardless of the timing of the closure announcement (31%). A far greater share of students is not enrolled in the public school system (neither a DCPS nor public charter school) the following year in cases of late closures (21%) as compared to timely notice of closures (14%). This data underscores the importance of notifications to families before the lottery closes, and ideally before it opens.
Figure 2. Where students from closed public charter schools enrolled the next year, by late closures and not late closures occurring SY2013-14 to SY2024-25

Note: There were 10 schools that met the late closure criteria and 23 that did not. Maya Angelou PCS – Academy at DC Jail is excluded here because it is a placement-based school. See the DME’s Part 1 public charter closure blog for more details.
More than half of students from closing public charter schools with a takeover option enrolled at the takeover school.
Takeover schools can provide families with continuity, and they also work best when families understand both the takeover option and other school alternatives. Takeover schools assume the closed school’s students and often physical assets; students from the closed school are not required to submit a My School DC lottery application to attend. During the timeframe analyzed, there were 13 takeovers: 10 by public charter schools, two by DCPS schools, and one by OSSE (this school subsequently closed the following year with no takeover). More than half (57%) of the 4,609 students in the closing public charter schools with a public charter, DCPS, or OSSE-managed takeover option enrolled at the takeover option.
The share was similar among the subset of 3,296 students with a public charter takeover option: 57% or 1,883 enrolled in the takeover, 14% enrolled in a different public charter school, 14% enrolled in a DCPS school, and 15% were not enrolled next year per the enrollment audit. Two closed public charter schools were assumed by DCPS the following year, with a similar share of 58% of students enrolling in the takeover option.
Many of the closed-takeover school pairings faced unique circumstances, which led to wide variation in the share of students who enrolled in the takeover option the following year (for example, whether the takeover school acquired the closing school facility). In a future blog, DME will provide more detail on these circumstances to help identify patterns that can inform policies such as DC PCSB's school reorganization policy.
Students from closed public charter schools dispersed across many other schools the following year.
Students from closed public charter schools tend to disperse to many different schools, regardless of the presence or absence of a takeover school option. The wide dispersion of students across dozens of schools each year demonstrates the array of options families consider when evaluating next steps, similar to the choices made by the majority of District public school families. The median number of schools where students enrolled in non-takeover situations was 38 with the median student enrollment at each school ranging from 1 to 4. In takeover situations, the median number of schools of enrollment was 48 with the median student enrollment ranging from 1 to 2.
A small but notable subset of students experienced multiple closures.
There were also 641 students from closed schools who went on to enroll at other public schools that later closed within the analytic timeframe. This highlights the need for families to be aware of their new charter school’s financial standing, progress towards charter goals, academic achievement, and financial compliance to avoid experiencing additional closures. Most of these students were enrolled at two closing schools (632), while nine students were enrolled in three closed schools. One series of closures account for more than a quarter of students experiencing multiple closures: 171 students were enrolled at Community Academy PCS Amos III Armstrong in SY13-14 and subsequently enrolled in Community Academy PCS Butler Global (a school in the same LEA that had co-located in the same building as Amos III) in SY14-15. (See Table 1 for instances impacting more than 10 students.) More than half of students enrolled at multiple closing schools experienced two consecutive years of closures (362 or 56%).
Table 1. Number of students impacted by multiple closures with first and subsequent closures, SY2013-14 to SY2024-25

Notes
[1] Washington Metropolitan Opportunity School, a DCPS alternative school, closed the end of SY2019-20 and students were able to enroll at other existing DCPS alternative schools, at their in-boundary DCPS school, or at other schools via the My School DC lottery. Two former special education schools, Mamie D Lee School and Sharpe Health School, were included in the DCPS 2012 closure announcement and consolidated into River Terrace Education Campus, a newly modernized full special education school located at the former River Terrace ES, in SY2014-15. Brookland @ Bunker Hill Education Campus reverted to an elementary school (serving only up to 5th grade) and designated its middle grades to the newly reopened Brookland MS in 2014-15.
[2] See Appendix 1 for a listing of individual school closures including location, closure mechanism, timing, and reasons.
[3] Students enrolled at Maya Angelou PCS at the DC Jail, which is included in the count of 34 closures, are also excluded from this analysis.
[4] This includes students who enrolled at two DCPS citywide schools that took over closing public charter schools: Dorothy Height ES in SY2015-16 and Excel Academy in SY2018-19.
DC’s Education Progress Wasn’t Accidental. We Must Protect What’s Working.
May 29, 2026 by Paul Kihn, Deputy Mayor for Education
The District of Columbia now leads the nation in academic recovery in both math and reading. We are recognized as the fastest-improving urban school system in the country. Graduation rates are at all-time highs, more students are earning college credit and workforce credentials before graduating high school, and DC offers the highest starting teacher salary in the nation.
Those gains did not happen by accident. They happened because the District stayed focused on evidence-based strategies, used federal COVID relief funding to expand proven programs, and maintained a long-term commitment to improving student outcomes.
Now, DC is entering a very different fiscal era than the one we have operated in for much of the past decade. Revenue growth is slowing, costs are rising, and the District will have to make harder choices with fewer new resources.
That reality makes this year’s education budget more important, not less. At a moment when the District is seeing measurable gains for students, maintaining progress requires continued focus on the programs and policies that are actually producing results.
That is what Mayor Muriel Bowser’s FY27 Grow DC budget does. Rather than pulling back from the strategies driving improvement, the budget protects investments in high-impact tutoring, attendance interventions, career education, afterschool programming, and early childhood education.
That approach starts with recognizing that student success does not begin and end when the school bell rings. Since 2017, the Bowser Administration has invested more than $140 million in afterschool and summer programming serving more than 103,000 young people across the District. Through MOST-DC, families can now search and register for programs across the city through one centralized platform, making high-quality afterschool opportunities easier to access.
The District is also expanding the connection between education and workforce opportunity. At the Advanced Technical Centers (ATCs) in Wards 5 and 8. Students from across the city, DCPS and public charter schools alike, come together to earn college credits, industry credentials, and workforce experience in high-demand fields like healthcare and cybersecurity. High schoolers tell us they don't always see how their coursework will apply in the real world, and the ATCs provide student with hands-on learning in high-demand fields where students can directly apply what they learn and prepare for what’s next.
The same focus on practical, evidence-based intervention is shaping the District’s response to absenteeism and academic recovery. The Truancy Reduction Pilot helps reconnect students and families to schools through supportive interventions rather than punitive responses. High-impact tutoring is also accelerating learning recovery, adding the equivalent of 59 instructional days for participating students.
The District must also continue supporting the systems that strengthen teaching in our schools. IMPACT, DC Public Schools’ (DCPS) educator evaluation and feedback system, rewards excellent teaching and helps to attract and retain educators in our schools, with a particular focus on recruiting effective educators to high-poverty schools. DCPS retains the overwhelming majority of its highly effective and effective teachers and teachers departing the system do not cite IMPACT in the top ten most common reasons for leaving. Accountability and support are not opposing ideas. They are part of how school systems improve and are at the heart of DCPS’s improvement journey.
Critics will understandably ask whether the District can afford to continue these investments during a tighter fiscal period. The better question is whether we can afford not to. Educational progress is fragile. School systems do not improve because of one strong year or one-time, temporary funding streams. They improve when cities stay committed long enough for investments to take hold.
DC still faces serious challenges around absenteeism, enrollment declines, and equity gaps. But the city has built real momentum over the last decade. This budget reflects a simple choice: build on what is working instead of retreating from it.
The State of Schools in Washington, DC Is Strong — and Getting Stronger
March 26, 2026 by Paul Kihn, Deputy Mayor for Education
This blog post is adapted from remarks delivered by Deputy Mayor for Education Paul Kihn at the D.C. Policy Center’s annual “State of Schools” event on March 11, 2026, highlighting key findings from the 2024–25 State of D.C. Schools Report
The state of schools in Washington, DC is strong. We beat ourselves up all the time because we ask the question, is it strong enough? And the answer to that is, of course, no. But the state of the schools is strong and getting stronger every single year. We have a lot to be proud of.
How do we know that the state of the schools is strong? When I think about our strength, I think about teacher retention, which is now up at 78% same school retention across the city. While across the country, high-need schools usually see about 30% or more of their teachers leave every year.
Our academic achievement is unsurpassed in the country in terms of growth. This year, we saw 3.6% growth in ELA [English Language Arts] and Math in our very rigorous DC CAPE [Comprehensive Assessments of Progress in Education] assessments. You'll recall last year, on NAEP [National Assessment of Educational Progress], we learned that DC as a location was the same or better across all four of the tested areas, unlike the country that saw declines. So, our academic achievement remains strong.
And of course, our graduation rate is remarkable. This year, we're up at 78.7%. In 2011, it was just over half. That's 26 points over that period of time that we've improved. Think of the number of young people now who are walking across the stage because of the work that we’re all doing.
Now, of course, it's not just enough for us to say the state of the schools is strong and reflect on it. We have got to ask the question, why? Why have we seen this dramatic improvement across our city in our public schools? We have to ask why, because if we don't understand why, or have a perspective on that, we are not going to sustain the things that actually are working. We are at risk of abandoning the drivers of our success. And so today I want to share a couple of reflections on why I think the schools have been improving.
First and foremost, of course, is the incredibly hard work of teachers, leaders, and entrepreneurs. Recently, I have, as many of you, been celebrating Susan Schaeffler's tenure at KIPP DC. And when you listen to the stories of 2001, 2002, schools in church basements, anti-Charter advocacy, and a split City Council, it is remarkable the work that went into creating the system that we now take for granted.
Leadership is another core element of why we're here. We have seen remarkable leadership over the last 30 years in the city, in our Mayors, in council, amongst our systems, at schools. Leadership is courageous. Leadership is as good as its people. We've been very, very fortunate.
Another important reason for our success is, of course, the money. The city has monumentally invested in our public schools. In the past decade, that investment has doubled to $2.8 billion. And if you account for enrollment increases, we have increased our per-student funding 75%. I'm not an economist, but that's quite a bit higher than inflation. And that's an incredible investment in our young people.
Now, the money, of course, only matters if you spend it well. And I would argue we have been spending it well. We have a best-in-class per-student funding formula that is no accident. Our money follows our students, contributes more to those with greater needs, and goes to wherever they choose to go in our system. We have invested in our young people.
Our teachers’ starting salaries are the highest in the country. The highest. We respect and honor our teachers. And we have made very important investments in structured literacy, high-impact tutoring, and other things that we do as a system. So, we've been spending our money very, very well.
Now, when people say to me at cocktail parties, well, what's going on in the DC schools? Why are they so good? I don't talk about leadership or hard work or money. I talk about two things.
The first of those things I say is our schools are doing well because of 30 years of the public charter sector in the first instance. And our schools are doing well because of DCPS's turnaround and mayoral control that allowed us to invest heavily in our teachers and develop an evaluation system that is focused on individual development and performance, and growth.
It's the charter sector, DCPS's turnaround and mayoral control. Those are precious commodities in Washington, DC, and we have to continue to value and sustain them.
When you combine those together, you see that we are building more and more coherence. And the cross-sector collaboration has been an extraordinary contributor as well. For example, My School DC-what a gift for families and parents. The Advanced Technical Centers led by OSSE (Office of the State Superintendent for Education), is the product of incredible cross-sector collaboration to provide access to college credit and advanced career and technical education coursework that otherwise students wouldn't have.
So that's why I think we've gotten better. Those are the things that I think we should cherish and honor and sustain. And we're going to need it because we have a lot of hard work in front of us.
Enrollment, that is a headwind. This year, we declined slightly. And we know that we've been expecting a decrease in enrollment, and now it's likely going to hit us hard.
We have a chronic absenteeism challenge in the city. It's stubbornly stuck at 39%. That's more than a third of our young people that we're working extremely hard to resolve.
We've got stubborn equity gaps that we all know about and work on every single day.
And there are very strong economic headwinds. AI is the elephant in every single room. And this world and the world of work and the world that our children are inheriting will look very, very different whether we want it to or not. And we've got to make sure we're getting them ready.
So, we've got to keep doing the very hard things. We've got to keep working together. We have to keep expanding access to quality schools.
These are the hard things we've got to do. We have to get better and more creative about training our educators and working with students with special needs. In the charter sector, we have to hold the line on quality and accountability and be more strategic about our openings to focus on quality and unmet need.
So too in DCPS, where we have to recommit to the excellence of every single neighborhood school so that families, through their by-right schools, have access to meaningful choice. And we have to sustain fair and equal funding across all of our students, and we cannot lose sight of that.
We have to embrace AI. We've got to teach it in schools, unleash our teachers on it, get our youth ready for this vastly new world that we are handing to them.
We've got so much left to do, but in the midst of this work, we cannot forget that together we have built something incredibly special. Something that no other place in the country has. And it's really, really important that we sustain it.
The story is clear. The state of DC schools is strong and getting stronger. Let’s keep it that way.
Making dollars and sense: how DC funds our public school systems through the uniform per student funding formula
October 8, 2025 by TJ Sell, Director of Budget and Performance | [email protected]

Investing in our Students
It’s back-to-school season in the District, and while our nearly 100,000 students are heading into math class, we’ve been focused on the math that makes up our public schools’ budgets. This year, DC allocated over $2.8 billion to support public schools across the city. Most of these dollars flow through the Uniform Per Student Funding Formula (UPSFF), which provides per-student dollars to local education agencies (LEAs).
The UPSFF is a best-in-class funding approach built on two principles: stability and equity. It provides consistent funding for every student while targeting additional dollars to students with greater needs.
Stability: A Strong Foundation for Every Student
Each year, central to the UPSFF is the foundation level — the base amount of funding allocated per student — which is adjusted for different grade levels to reflect the cost of services required learning stage. Over time, this foundation level has grown in step with the real costs of providing a high-quality education. Since 2015, the foundation level has increased by nearly 60%, rising from $9,492 to $15,070 per student for the current school year
Equity: Targeting Resources Where They’re Needed Most
Because students have diverse needs and circumstances, additional resources beyond the foundation level are vital for LEAs to meet those needs. The UPSFF accomplishes this through supplemental weights which serve as multipliers of the foundation, including:
- Special education students
- English language learners (ELL)
- Students considered “at-risk” (such as those experiencing homelessness, in foster care, or qualifying for federal assistance programs)
For example, last school year the at-risk weight increased from 0.24 to 0.30, adding an additional $1,269 per at-risk student (see end of this post for a complete list of weights in the formula). These targeted investments help close achievement gaps, expand programming, and create safe, supportive learning environments across the District.
Research confirms that this methodology works. The Deputy Mayor for Education’s 2023 School Funding Study found that the UPSFF’s weights, amounts, and categories are aligned with national best practices and expert recommendations, ensuring our schools are robustly resourced year-over-year to meet the growing costs of delivering a high-quality education.
How Funding Flows to Schools
Funding through the UPSFF is budgeted for LEAs, based on projected enrollments for the coming school year. After the District’s annual budget is approved, LEAs then use allocation models to fund individual schools based on UPSFF and anticipated federal and private resources, giving them autonomy to align resources with individual school needs.
For example, DC Public Schools (DCPS) uses its School Funding Model to allocate both UPSFF and other revenue sources to its 117 schools. Principals work with Local School Advisory Teams (LSATs) made up of parents, educators, and community members to decide how to best budget total available resources.
Starting this School Year, DCPS introduced the School Sustainability Fund, which minimizes schools’ year-over-year shifts and ensures they can maintain appropriate staffing levels based on projected enrollments.
Beyond UPSFF: Other Funding Sources
While the UPSFF is the primary source of school funding, LEAs also receive federal, local, and private grants to supplement programming. For example:
- Federal Title funding: Last school year, LEAs received $73 million in Title grants to support English learners and students from low-income households and strengthen academic programming.
- Citywide programs: Local resources from other DC agencies such as the School Health Services Program (DC Health) and the School Behavioral Health Program (Department of Behavioral Health) provide critical health and wellness services in schools.
Together, these funding streams create a comprehensive support system that helps schools meet a wide range of student needs.
A Decade of Growth, A Future of Opportunity
If all of this sounds a little like Algebra class, that’s the point. The UPSFF is designed to serve our complex and evolving public school system that deals with different variables each school year. But here’s the bottom line: When we invest more in schools, students do better.
Over the past decade, UPSFF funding for LEAs has doubled. In that same period, DC has seen:
- More students enroll;
- More students graduate; and,
- More students succeed, including the largest gains in math and English language arts/literacy on statewide assessments since before the pandemic
These are not just numbers; they represent real opportunities and better futures for thousands of DC students.
To keep improving, the District convenes a working group of education advocates, LEA leaders, and public servants twice each year to review the UPSFF and recommend refinements. It’s part of our commitment to making sure every dollar counts and every student has what they need to thrive.
Learn more about how DC resources its 67 local education agencies by reading DME’s 2023 School Funding Study or how you can be part of the conversation by visiting the UPSFF and the District’s biannually-convening working group.
View the Appendix: UPSFF weights proposed for school year 2025-26.
Long-term public school enrollment projected to grow by 550 students by SY26-27, remaining above current levels until SY31-32
October 8, 2025 by Rory Lawless and Jenn Comey, Planning and Analysis | [email protected]
Contributions by Samuel Kligman, summer intern
Across the country, public school enrollment trends are in decline. However, enrollment in the District is expected to buck these trends in the short term, with 0.6% growth projected by SY26-27, after which a decline in enrollment is expected. While the District did rebound from the COVID-19 pandemic, the recovery shows signs of slowing, and declining births mean we may begin a corresponding fall in enrollment manifesting in the early grades.
- The strong post-pandemic enrollment recovery has driven steadier long-term enrollment projections compared to previous iterations.
- Higher birth-to-preKindergarten 3 (PK3) enrollment rates have shored up the public education system despite fewer births.
- Next year’s Master Facilities Plan Supplement will update the long-term enrollment projections capturing 2025’s emerging trends.
Following the disruption caused by the COVID-19 pandemic during SY20-21 and SY21-22, long-range enrollment projections predicted steep declines. However, starting SY22-23 the District experienced three years of enrollment growth. During this period, around 4,100 more students enrolled compared to SY19-20.
This strong enrollment recovery has, therefore, influenced the 2024 Master Facilities Plan (MFP) Annual Supplement 5- and 10-year enrollment projections. These latest projections using a baseline of SY24-25 show continued enrollment growth through SY26-27, contrasting with previous predictions of decline. Between SY24-25 and SY26-27, the DME projects 550 more PK3 to 12th grade and Alternative students will enroll, meaning an enrollment peak of almost 94,000 public school students.
Figure 1: Comparison of actual PK3-12 and Alternative enrollment and projections

While these trends illustrate the resilience of DC’s public education system, the projections show the increased pressure of declining births on enrollment. By 2023, the annual number of births had fallen by almost 2,000 since the peak of 9,854 in 2016. Preliminary numbers for 2024 show a further decline of around 300 compared to 2023.
Figure 2: Births since 2013

Fewer births, without being offset by positive net migration (domestic or international), reduce the number of students eligible to enter the system which, in turn, impacts enrollment as cohorts move through. The DC public education ecosystem has, nevertheless, tempered the impact of this trend by enrolling a higher proportion of eligible students in PK3. By SY23-24, PK3 enrollment was 62% of births in 2020, exceeding the pre-pandemic high of 60.9% in SY18-19.
However, signs of stagnation were evident in SY24-25. PK3 enrollment as a percentage of 2021 births declined to 61.4%, which remains above the SY18-19 level but translates to 181 fewer students compared to SY23-24. The projections assume a continuation of this two-year trend, meaning annual decreases in PK3 enrollment are projected until SY29-30. The impact of smaller cohorts endures throughout the projection period and contributes to a loss of 590 students by SY35-36 compared to SY24-25.
SY29-30 is the first projected school year showing a return to growth based on birth forecasts, but projections this far in the future ought to be considered with caution. One reason for this warning is the continued decline in births which has outpaced the Office of Planning forecasts upon which these projections are based.
These projections do not account for new factors impacting the District in 2025, such as the recent federal workforce layoffs, transfer of federal agency personnel to locations outside the District, and latest immigration efforts. The DME will update the enrollment projections annually each spring to take account of such trends.