Sorry, you need to enable JavaScript to visit this website.

dme

Office of the Deputy Mayor for Education
 

DC Agency Top Menu

-A +A
Bookmark and Share

Interactive Maps

View and interact with these maps created by DME's Planning, Data, and Analysis team.
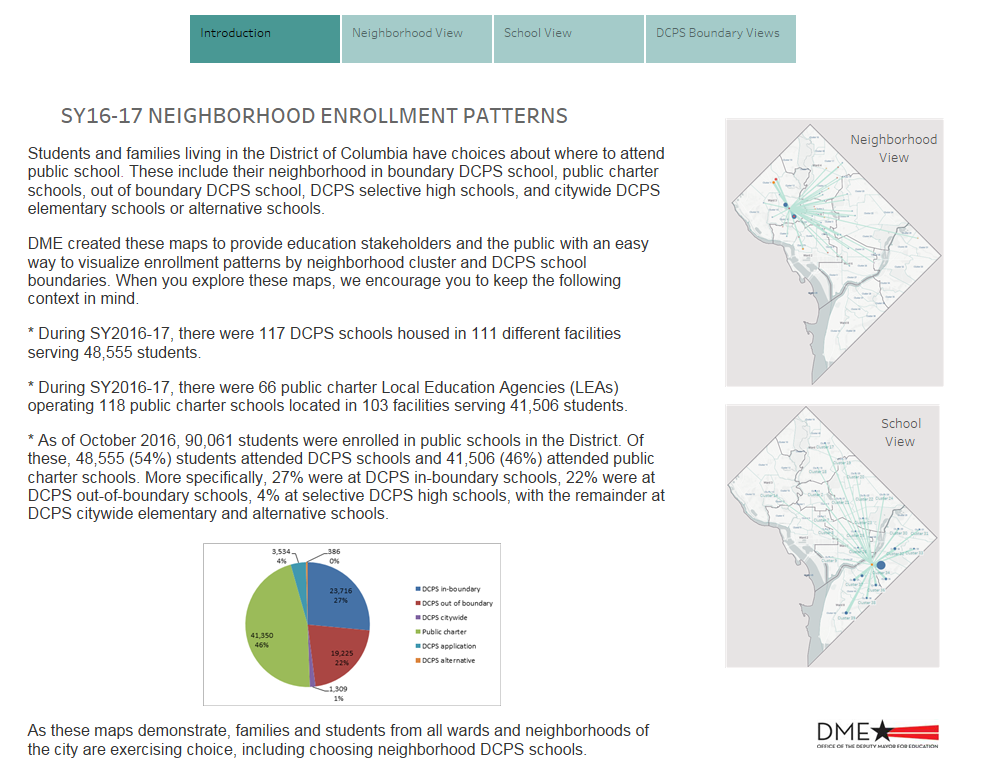
Image of map of DCPS facility utilization and in boundary participation ratesPublic School Facilities: Search for SY2023-24 public schools by name, grades served, wards, and sector. 


Image of Safe Passage MapSafe Passage to School: Plan your route to school with this map combining Public Schools, Safe Passage Priority Areas, DDOT Crossing Guard locations, and more.


Image of a map of SY2016-17 DCPS Utilization Rates and In-boundary PercentagesDCPS Facility Utilization and In-boundary Rates: View the SY2016-17 utilization rates of DCPS school facilities and the rate of students attending DCPS schools living in the school's boundary.


Image of map of DCPS Facility Modernization StatusDCPS Facility Modernization Status: Examine the modernization status of DCPS Facilities per the FY2018-2023 Capital Improvement Plan.


School Year 2016-17 Neighborhood Enrollment Patterns Student Enrollment Patterns: Visualize enrollment patterns in the District via a series of interactive maps displaying where students from each DC neighborhood cluster and DCPS boundary attended public school in SY2016-17.