
View and interact with these maps created by DME's Planning, Data, and Analysis team.
 Public School Facilities: Search for SY2023-24 public schools by name, grades served, wards, and sector.
  Safe Passage to School: Plan your route to school with this map combining Public Schools, Safe Passage Priority Areas, DDOT Crossing Guard locations, and more.
 DCPS Facility Utilization and In-boundary Rates: View the SY2016-17 utilization rates of DCPS school facilities and the rate of students attending DCPS schools living in the school's boundary.
 DCPS Facility Modernization Status: Examine the modernization status of DCPS Facilities per the FY2018-2023 Capital Improvement Plan.
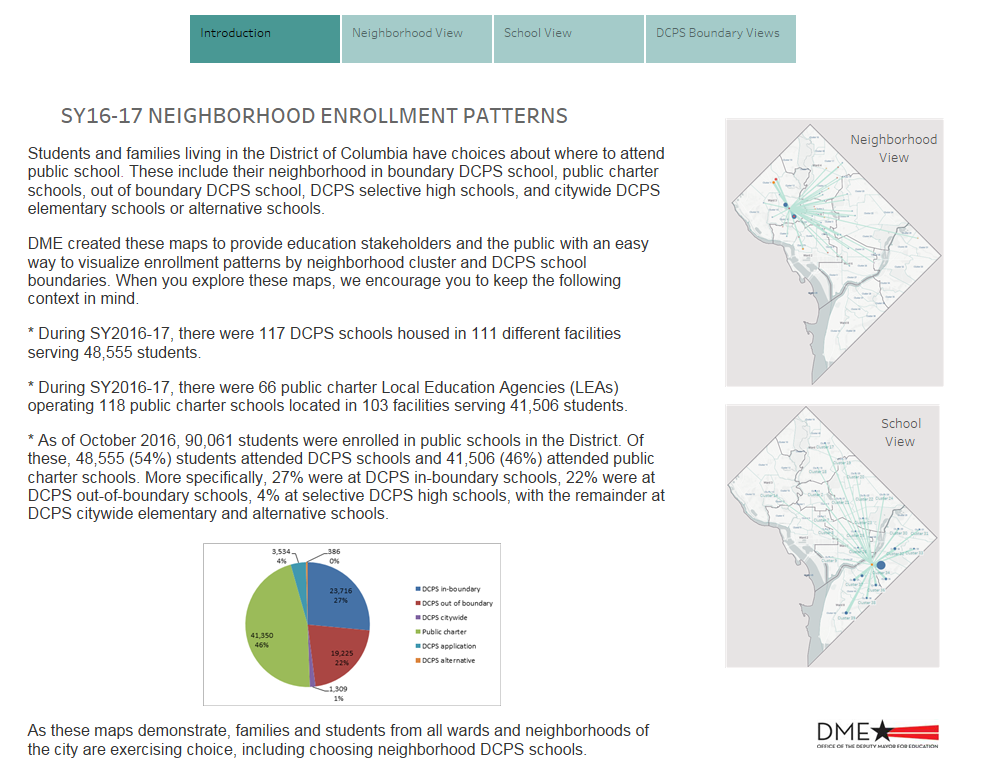 Student Enrollment Patterns: Visualize enrollment patterns in the District via a series of interactive maps displaying where students from each DC neighborhood cluster and DCPS boundary attended public school in SY2016-17.